Saturday, May 21, 2011

Matching Experiments using NCC

The detected features in the 1s image (rotated 40degrees in z-axis) are located in the second image (-10 degrees in z-axis) using NCC. The size of the template is determined by the scale where the feature was detected.


We observe that the matching does not perform well, since the scale where the feature was detected in the image plane is not representative of the real size of the patch we are looking for in the second image.

Wednesday, May 18, 2011

Matching Experiments using Shape Context

We perform experiments matching the SIFT points and the extrema points extracted using our LB algorithm. We use the shape context approach proposed by Belongie et al.[1] and the software available at his website to compute the descriptors based on the extracted points. The matching algorithm uses the approach proposed by Ofir Pele and Michael Werman [2]. The code is available at the author's webpage.

Matching LB points

The first experiment matches the 2 point sets obtained using our approach:


We observe that the points in the second image are mostly located on the periphery.


Matching SIFT points


Since the shape context approach considers the points as a unity, i.e., the points are related to each other in a certain way. That structure should be preserved from one image to the other.

The following example uses the extracted points using our approach in the first image and the SIFT points in the second. Coincidently the structure of the set points are similar.

Matching LB points with SIFT points


We need to explore this situation and to evaluate if the shape context approach with the extracted points seen as sets of points are suitable for the matching step.

[1] G. Mori, S. Belongie, and J. Malik. "Shape Contexts Enable Efficient Retrieval of Similar Shapes".CVPR 2001
[2] Ofir Pele and Michael Werman. "The Quadratic-Chi Histogram Distance Family". ECCV 2010.

Wednesday, May 11, 2011

Repeatability Experiment

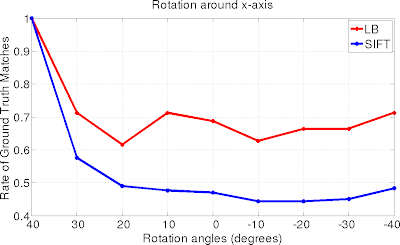
We perform rotations from -40 degrees to 40 degrees in x-axis and y-axis. The transformations of the image corresponding to the y-axis are more drastic. We show the images corresponding to -40 degrees and 40 degrees rotations in both axes.

Y-AXIS

X-AXIS


We show the feature obtained with the LB approach in the rotations around the y-axis (-40º and 40º)

Now we show the results of the repeatability experiment, compared to the normal Scale Space obtained by SIFT (we use Vedaldi's implementation to modify the number of scales and octaves).

Sunday, May 1, 2011

Computing the Scale Space using the Laplace-Beltrami Operator (LPO)

Using the LBO we compute the scale space of omnidirectional images. We use the initial scale scale_0 = 0.8 and the definition of Arican's t_i = k^(2i)*scale_0^2. In opposition to other approaches that use the standard deviation. The full set of scales used are:

scale 1 = 0.8
scale 2 = 1.0159
scale 3 = 1.61.27
scale 4 = 2.56

We use the last image in each scale downsampled as the first one in the next scale. Here we show the first and last octaves.

FIRST OCTAVE


LAST OCTAVE


When the scale space is built, we perform the steps of the normal SIFT. We compute the differences of smoothed images to approximate the Laplacian of Gaussians (LoG). We observe the differences correspondig to the first and last octaves.

FIRST OCTAVE


LAST OCTAVE


Then the extrema are computed. Here we observe some results for different rotations and scales.


ORIGINAL AND DOUBLE SCALED:


ORIGINAL AND ROTATED